Can Protests Enact Change?
Can Protests Enact Change?
Using Cenpy to find population by county
We used Cenpy to extract the 2018 American Community Survey (ACS) from the larger list. We found various demographic variables but used only the Total Population. Then we found the counties dataset and merged the protest dataset to the counties dataset on the Counties and StateTerritory field in order to get the FIPS code. As a side note, previously we filtered out Guam, Puerto Rico, Hawaii and Alaska from the dataset in order to focus on the continental United States.
After the merge, there were still a few counties that had been entered incorrectly which we chose to correct some and then dropped the rest. We then merged the demographic data with the protest data and calculated the crowd percentage for each county. However, the crowd estimate presents the sum of crowds throughout the summer and not necessarily all related to each other so this is important to note.
One conclusion from the data is that some counties have a culture of protest more than others. Additionally, 2019 had fewer counties involved in protests than 2020. The counties that fit the 3.5% rule in 2019 include San Francisco County, Oklahoma County and Pitt County in North Carolina. In 2020, there were 24 counties that fit the bill. Additionally, many other counties made it on the map for where protests occcured.
Here you can see visually the increase in the amount of counties that had protests occur from Summer 2019 to Summer 2020:
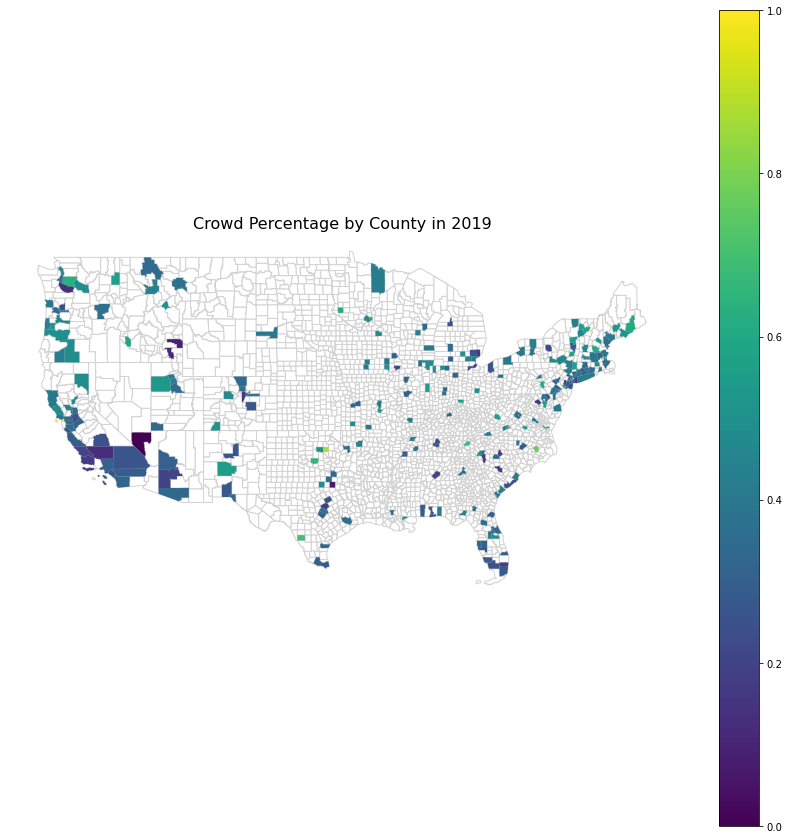
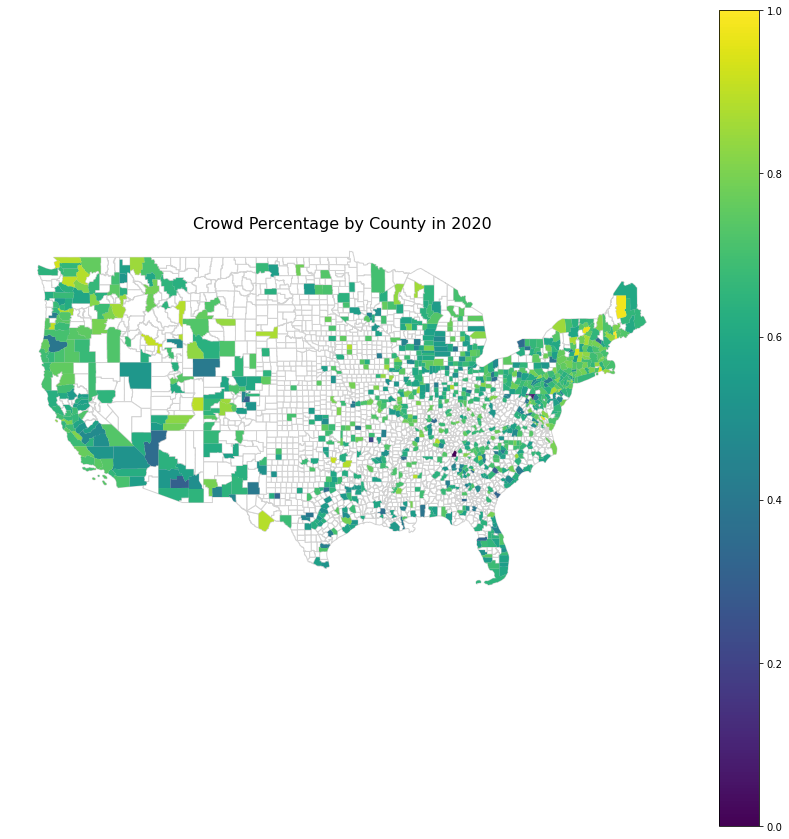
And now you can see and explore the crowd sizes as percentage of total population in both Summer 2019 and Summer 2020. (Somehow California and perhaps other counties have gone missing and we will have to explore at a later point to find them).
There has definitely been an increase in civic engagement and protest from one summer until the next!