Introduction
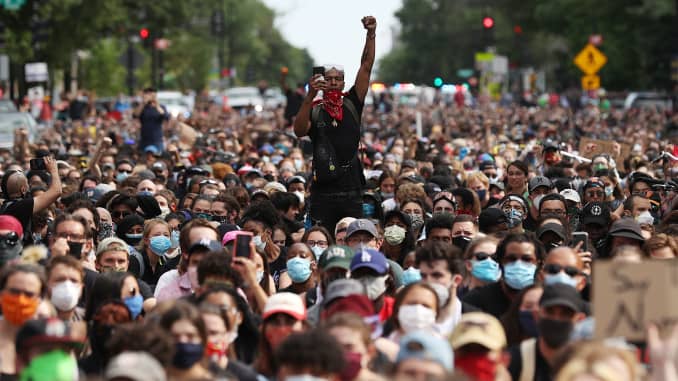
The year 2020 has been marked by many pandemics: COVID19, mass economic shutdown, and unrest caused by racial inequities and political leadership. All of these events have been met with protests and an urging from civilians that things should and need to be better. The question becomes: what are people protesting and are protests an effective source of enacting change at a local or federal level?
Erica Chenoweth set out to empirically prove that civil resistance is more successful than armed violence and that it can create effective change. In this Ted Talk, they discuss a rule they founded known as the 3.5% rule. This rule states that if 3.5% of a given countries population is actively involved in protesting, they can topple the government. This rule was particularly popular when it was unclear if Donald Trump would give up the presidency. If he had won or refused to accede, would the country have been able to topple him?
While it is scary to consider the delicate nature of our democracy, this rule, if true, gives power to the people in perhaps beneficial ways. My project seeks to analyze trends from Summer 2019 and Summer 2020 to see the popularity of protest subjects, types of protest and crowd size. It then uses US census data to get information on population at the county level and identify if there are any counties in the US in which at least 3.5% of the county population protested. Ultimately, we will display these results visually and see if we can identify counties with strong protest trends.
The inspiration for this project taken from this New Yorker article and the data was provided by the Crowd Counting Consortium.
Methods:
- Importing the data and concatenating Summer 2019 and Summer 2020 dataframes
- Cleaning the data
- Creating visualizations by protest claim, event type and date to make some meaningful observations
- Use Cenpy to get total population data for each county in the US
- Merge demographic data with crowd counting data by county
- Calculate to see which county had 3.5% or more of their total population at a protest
- Merge in county geometries and display visually