Tova Perlman

Recent graduate of UPenn ('21) with a Master's in Urban Spatial Analytics
My interests lie in using data visualization and analytics to identify spatial patterns and create compelling stories specifically around urban policies, affordable housing, gentrification, and racial justice.
Portfolio Projects
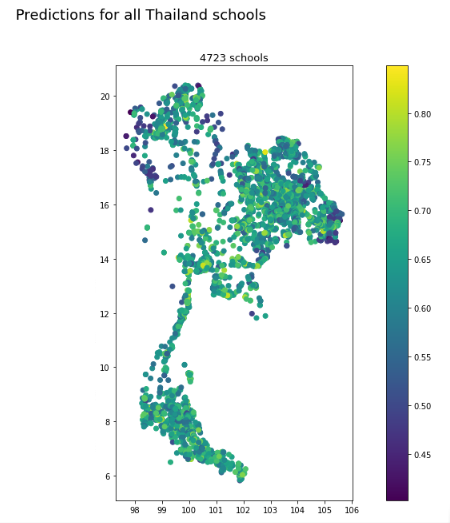
Mapping the World’s Offline Population
This project develops a predictive model to estimate the number of people connected to the internet (internet, in this instance, is a proxy for access to social and economic opportunities). The model was trained on a combination of survey data and multiple open source datasets. With the help of the custom engineered data gathering pipeline, the open source data can be collected for any given country and either the existing model can be applied or a new model can be trained if survey data is available. Click here to see our documentation as well our github repo with all our scripts here.
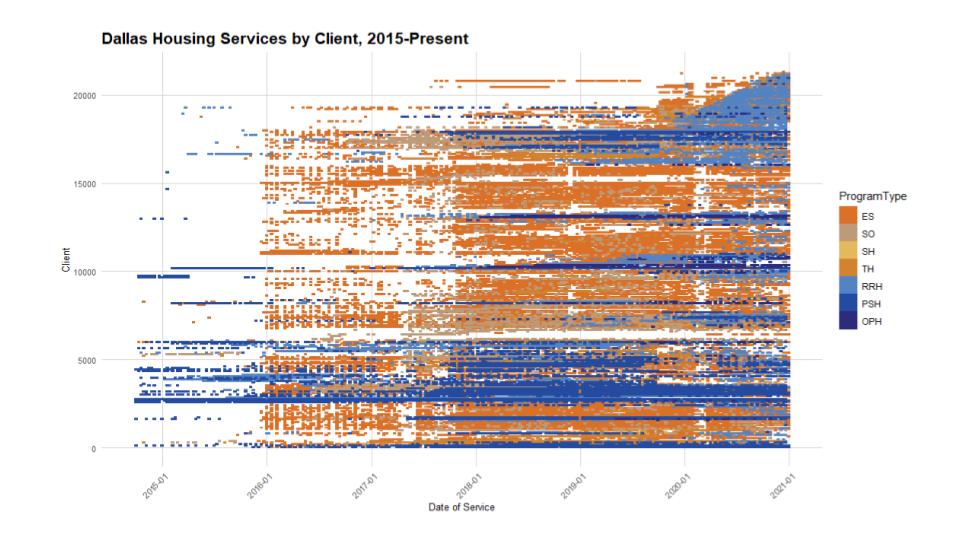
Predicting Homelessness
This semester long group project used data gathered from the Federal Homeless Management Information System (HMIS) to predict the likelihood of an individual experiencing homelessness within Dallas and Collins counties in Texas. The likelihood scores were aggregated to the service provider level in order to better understand which providers have more clients predicted to be homeless. The scores were put into a web application that enables overall viewing as well as seeing subset population predictions based on demographics such as race, gender or income level. Click here to see the web application as well our R markdown report of the project.
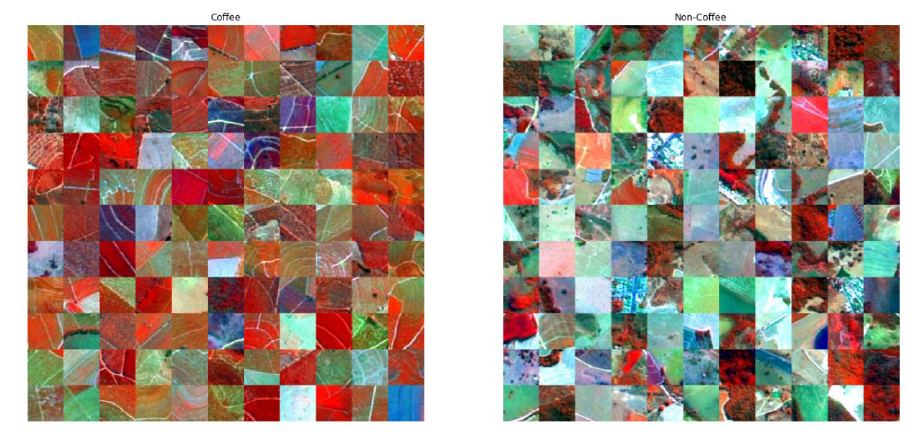
Using Remote Sensing for Brazilian Coffee Cultivation
Throughout the semester, I studied supervised and unsupervised image classification methods within machine learning and deep learning. For the final project, I attempted to find high accuracy in classifying land images in Brazil for whether they were good for coffee cultivation. I initially used SVM and Random Forest from scikit-learn, but increased accuracy to 79% using Keras API for TensorFlow and various hyperparameter tuning. Click to see the final report and presentation slides.
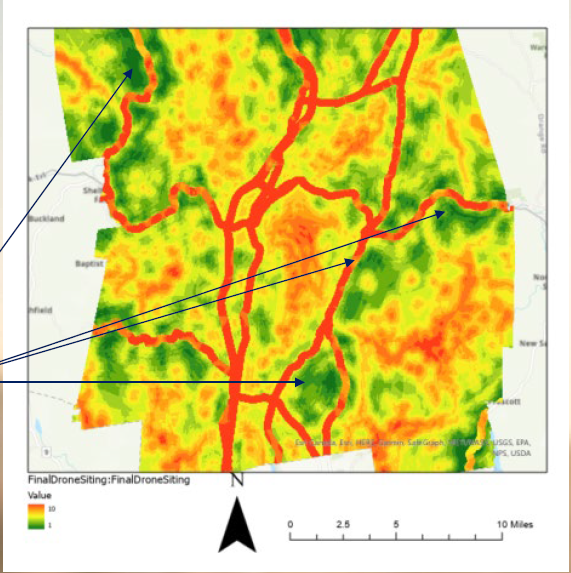
Modeling Geographic Space
This course taught me how to manipulate raster data in ArcGIS Pro. Click to find projects related to site suitability for a drone site, a cost distance analysis for a proposed bandit getaway and a clustering analysis around gun violence in Philadelphia. These projects both present my technical skills in using tools of ArcGIS while also exemplifying my presentation skills and ability to explain and justify my reasoning to a non-technical audience.
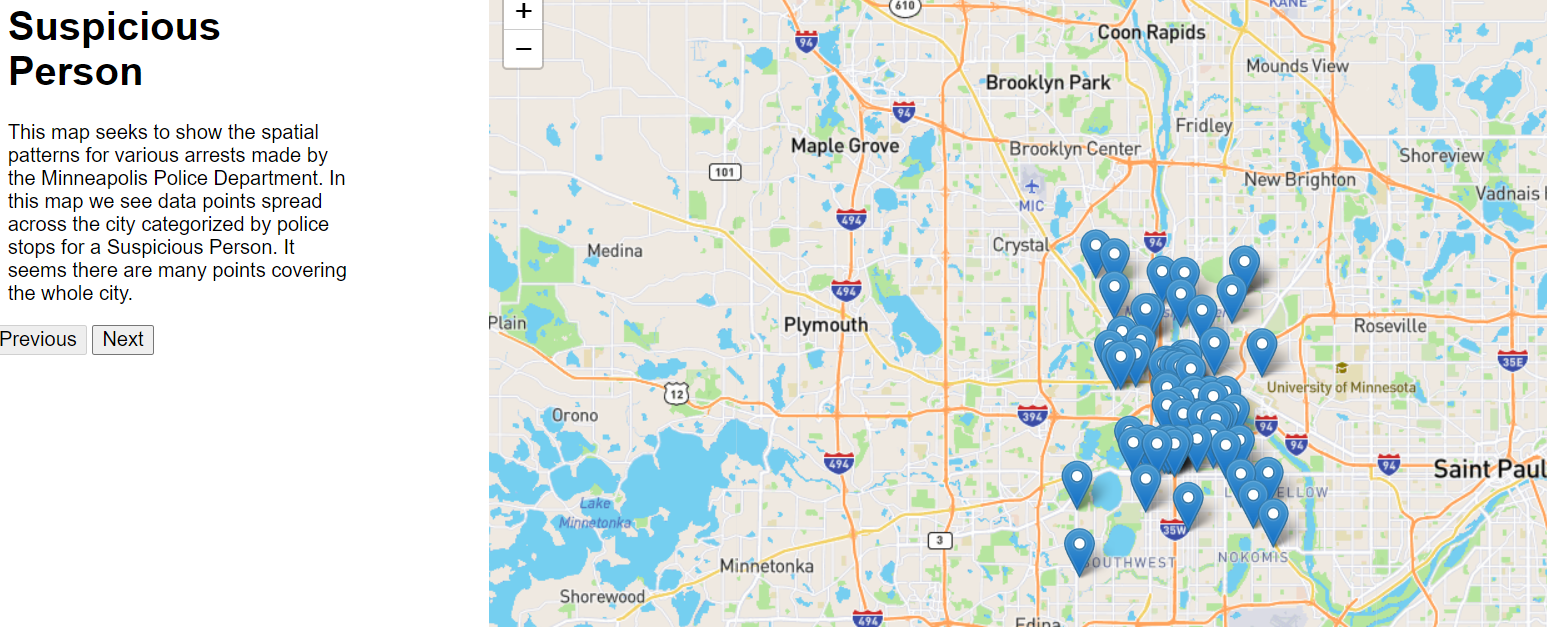
Where Do Police Stops Occur?
As someone who cares deeply about racial justice and policing, I felt it was important to work on projects that examine the Minneapolis police force specifically around the time of George Floyd’s murder. This basic map web application shows the spatial patterns of Minneapolis Police stops around that time. In a future iteration of this map, I will explore the spatial pattern more closely with other various demographics.
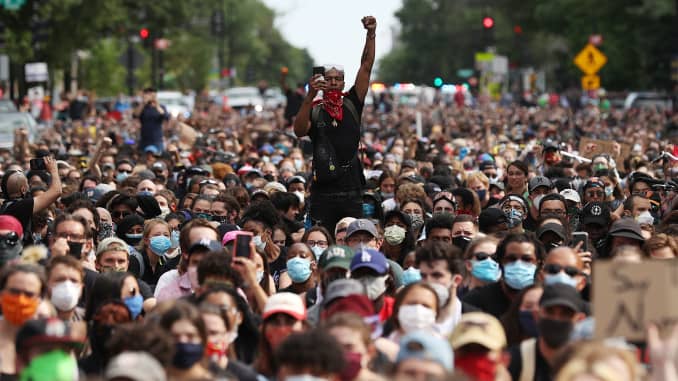
Visualizing 2019 and 2020 Protest Trends
Using data from the Crowd Counting Consortium, this project analyzed trends from categories such as claims, event types and crowd size between Summer 2019 and Summer 2020 protests. I then used cenpy to determine which counties in the US had 3.5% of their population participating in protests. This rule, theorized by Erica Chenoweth, states that if 3.5% of the total population protests a specific cause then citizens can overturn the existing power and create change. Thus, my project seeks to find out if this occurred in any counties in the US in 2019 and 2020.
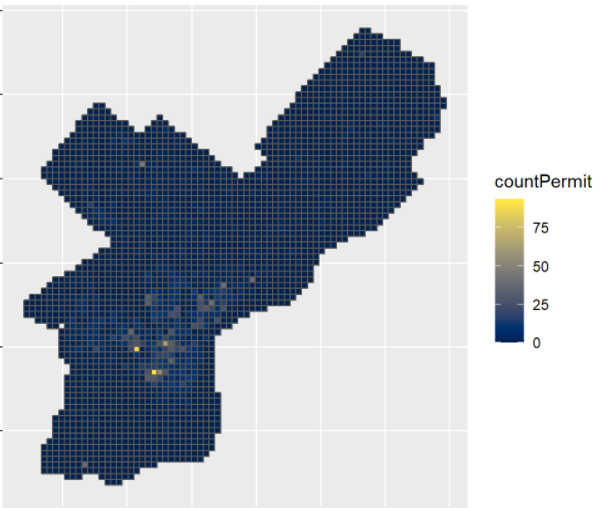
Forecasting Gentrification in Philadelphia
Using new construction permits as a proxy for gentrification, my partner and I built a geospatial risk model in R that predicts gentrification in Philadelphia within the next five to ten years. We used predictors like Starbucks locations, eviction filings and grocery store access in our regression to create a more accurate picture of permit locations.
Modeling the Allocation of Housing Credits
Housing is a topic I am very passionate about and I was pleased to build this model in order to further explore how to target consumers for housing credits. This algorithm builds on business models using confusion matrices to determine which customers should be sent promotional materials about housing credits. Within this project, we had to decide how false negatives and false positives are viewed in a public sector environment as opposed to a business churn environment.

Mapping Dead Sea Shrinkage using Google Earth Engine
The Dead Sea is slowly shrinking which has huge economic, political and social implications for the entire region. Using Google Earth Engine, I mapped and calculated the shrinkage and noted the correlation between the receding coast and development around the area.

Memo to Mayor on Predicting Recidivism Rates
A uniquely ugly part of the racist society we live in is its effect on mass incarceration and the lives of Black and Brown people. One project assignment encouraged us to build a model that more equitably predicts the recidivism rates among both Black and white prisoners. The link is a memo we were assigned to write to a city official encouraging them to adopt the new model. Hopefully, it illuminates the importance of strong communication and explanation surrounding algorithmic fairness and cognizance of machine biases.

Page template forked from evanca